Americans Increased Spending at Restaurants, on Takeout During Pandemic
In the months since COVID-19 first emerged in the U.S., consumers are spending more money than before on food away from home, our latest LendingTree study has found.
Americans spent 23.1% more at restaurants and takeout places this past January than they did at the beginning of the pandemic in April 2020. Meanwhile, spending on food at home, including groceries, increased by only 10.7% in that time.
LendingTree analysts compared U.S. Census Bureau data from April 2020 to January 2021 to see how Americans’ food spending changed over the course of the coronavirus pandemic.
Key findings
- Food spending rose by 13.9% during the coronavirus pandemic. In April 2020, the average family was spending $1,141 a month on food. By January 2021, that figure was $1,299.
- Americans increased their spending on restaurants and takeout. The average household spent $292 on food away from home early in the pandemic, but that number hit $359 last month.
- Spending on food at home, including groceries, increased at a lower rate. While Americans are spending 23.1% more at restaurants and on takeout now than they were at the beginning of the pandemic, they’re only spending 10.7% more on groceries.
- Mississippi, Alabama and Hawaii households increased their food spending the most during the pandemic. Each of these states increased their food spending by more than 25% between April 2020 and January 2021.
- Households in the District of Columbia and Kentucky decreased their food spending during the pandemic. Food spending decreased by 4.5% in the nation’s capital and 1.9% in Kentucky.
- Despite the increase in food spending, 11.3% of Americans experience food insecurity. A third of people who don’t get enough food say it’s because they can’t afford more. In addition, 41.8% of people who aren’t working because their employer went out of business due to the pandemic aren’t getting enough to eat.
Americans increased their food spending 13.9% during the pandemic
Food is a big slice of any household budget. A few factors typically affect how much a family spends on food, like household size and state of residence, though the coronavirus pandemic has also influenced how much Americans are spending on food.
Total monthly food spending increased from $1,141 at the beginning of the coronavirus pandemic in April 2020 to $1,299 in January 2021. That’s a 13.9% increase in the nearly 10 months since the early stages of the pandemic.
Americans as a whole are spending much more on food now than they were in April 2020, and that trend holds strong in demographic breakdowns. Whether it’s the size of the household, the number of children in a household or even the annual household income, food spending is up in general when you compare January 2021 to April 2020.
Restaurant, takeout spending increased by 23.1% since April
The coronavirus pandemic has changed how Americans choose to spend their food budgets. The food service industry has been particularly impacted by social distancing measures, with restaurants in many states having had to limit capacity or transition to takeout-only service at some point during the pandemic. But the data suggests that Americans are reaching into their wallets to treat themselves (and support local businesses) about a year into the pandemic.
Spending on food away from home, including at restaurants and on takeout, increased by 23.1% between April 2020 and January 2021. The average household spent $292 on food away from home when COVID-19 first hit, compared with $359 now — a difference of $67.
Money spent on groceries and other food at home increased $91 from $849 to $940, a comparatively modest change. Households are spending 10.7% more on food at home now than they were at the beginning of the pandemic.
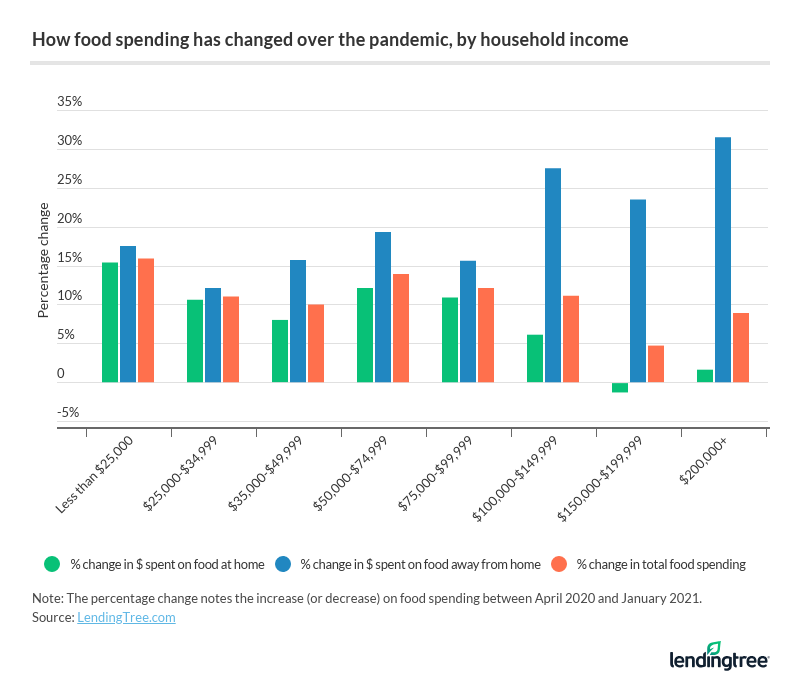
However, not all Americans are spending more on food away from home at such a high rate. While those with lower household incomes are still spending more money dining out than they were before the pandemic, they’re doing so at a much lower rate than those earning six figures or more.

Americans with a household income of $100,000 or more increased their restaurant and takeout spending at the highest rate, while increasing their spending on food at home at the lowest rate. One income bracket ($150,000 to $199,999) even spent less on food at home in January 2021 than in April 2020.
Increased food spending can lead to credit card overspending. If you’ve accrued burdensome high-interest credit card debt over the course of the pandemic, consider a balance-transfer card or debt consolidation loan.
Food spending changed the most during the pandemic in Mississippi, Alabama and Hawaii — and what else we learned
Food spending is up for Americans as a whole since April 2020, but some states saw larger increases in food spending than others. Total food spending grew at the highest rates in Mississippi (30.8%), Alabama (29.4%) and Hawaii (25.4%). Use the interactive map below to see how food spending has changed over the course of the pandemic in your state.
While total food spending increased since the early stages of the pandemic in almost every state, it did decrease in the District of Columbia (-4.5%) and Kentucky (-1.9%). Kentucky households also decreased their spending on food away from home by 12%.
Conversely, a few states saw their food-away-from-home spending increase by 50% or more:
| 3 states where restaurant, takeout spending increased the most | |||
|---|---|---|---|
| Connecticut | South Dakota | Hawaii | |
| April 2020 | $234 | $217 | $368 |
| January 2021 | $375 | $334 | $553 |
| % increase | 60.3% | 54.2% | 50.1% |
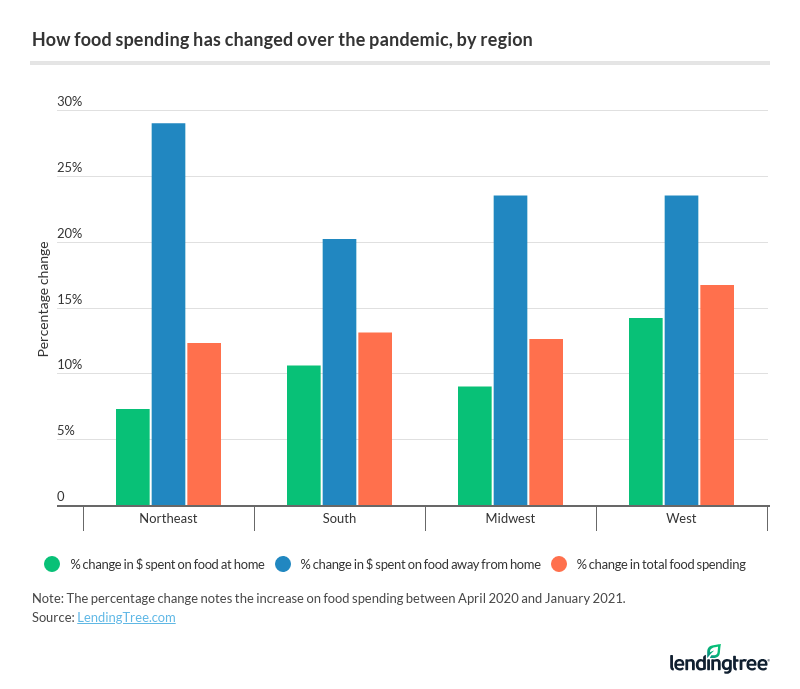
Certain regions also saw residents spend more money on dining out than others. Households in the Northeast spent 29% more on dining out this past month than they did early on in the pandemic. They also saw their food-at-home spending grow at a slower rate, at 7.3% versus the national average of 10.7%.

Food insecurity affects more than 1 in 10 Americans, despite increased food spending
While household food spending has increased overall between April 2020 and January 2021, millions of Americans still aren’t getting enough food to eat. Food insecurity, defined as a lack of reliable access to food, affects 11.3% of Americans, according to the same January 2021 U.S. Census Bureau data that was used to compile this report.
Those who are unemployed due to COVID-19 are still largely affected by food insecurity. Nearly a third (30.6%) of people who were laid off due to the pandemic aren’t getting enough food to eat, along with:
- 41.8% who said their employer went out of business due to the pandemic
- 28.9% who were caring for someone with coronavirus symptoms
- 26.1% who said their employer saw a reduction in business due to the pandemic
- 25.5% who said their employer temporarily closed due to the pandemic
- 22.5% who were sick with coronavirus symptoms
The purpose of this study was to see how food spending has changed since the coronavirus pandemic first started. But just because some of the tertiary effects of COVID-19 are wearing off in some aspects of life, that doesn’t mean there’s no one in America who’s going hungry.
If you’re struggling with food insecurity, see if you’re eligible for any of the following programs:
| Resources for Americans facing food insecurity | |
|---|---|
| National School Lunch Program and School Breakfast Program | Your child may be eligible for free or low-cost lunch and breakfast through their school. Get in touch with your child’s school’s administration to see if you’re eligible. |
| Special Supplemental Nutrition Program for Women, Infants and Children (WIC) | WIC provides additional food and nutritional resources to low-income pregnant women and children up to 5 who are found to be at nutritional risk. Contact your relevant WIC state agency to apply. |
| Supplemental Nutrition Assistance Program (SNAP) | SNAP benefits, also known as food stamps, are available to people who meet certain income and eligibility requirements. This program provides you with a food budget you can use to purchase groceries. Contact your local SNAP office to apply. |
You should also check with your local food pantry, food bank or soup kitchen to see what kind of meal assistance they can provide. These resources are often available to the hungry without strict income requirements and applications like the government programs listed above.
Methodology
LendingTree analysts estimated monthly food spending using survey results from the U.S. Census Bureau’s Household Pulse Survey to compare trends from early on in the pandemic with what’s happening now. Specifically, researchers compared survey results from Week 1 (April 23 to May 5, 2020) to Week 22 (Jan. 6 to Jan. 18, 2021).
Get personal loan offers from up to 5 lenders in minutes

